Skip to main content
Research
Projects
About
Contact
Menu
Food Rescue Calculator — analytical and Monte Carlo net-benefit model under the PATH Act enhanced deduction cap.
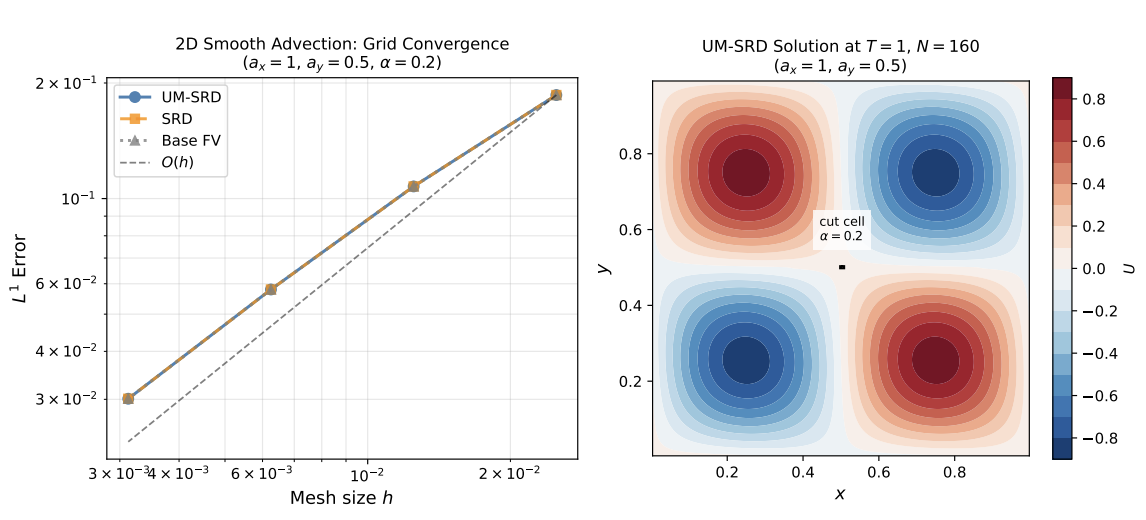
Grid convergence and UM-SRD solution at T=1, N=160 for 2D smooth advection.
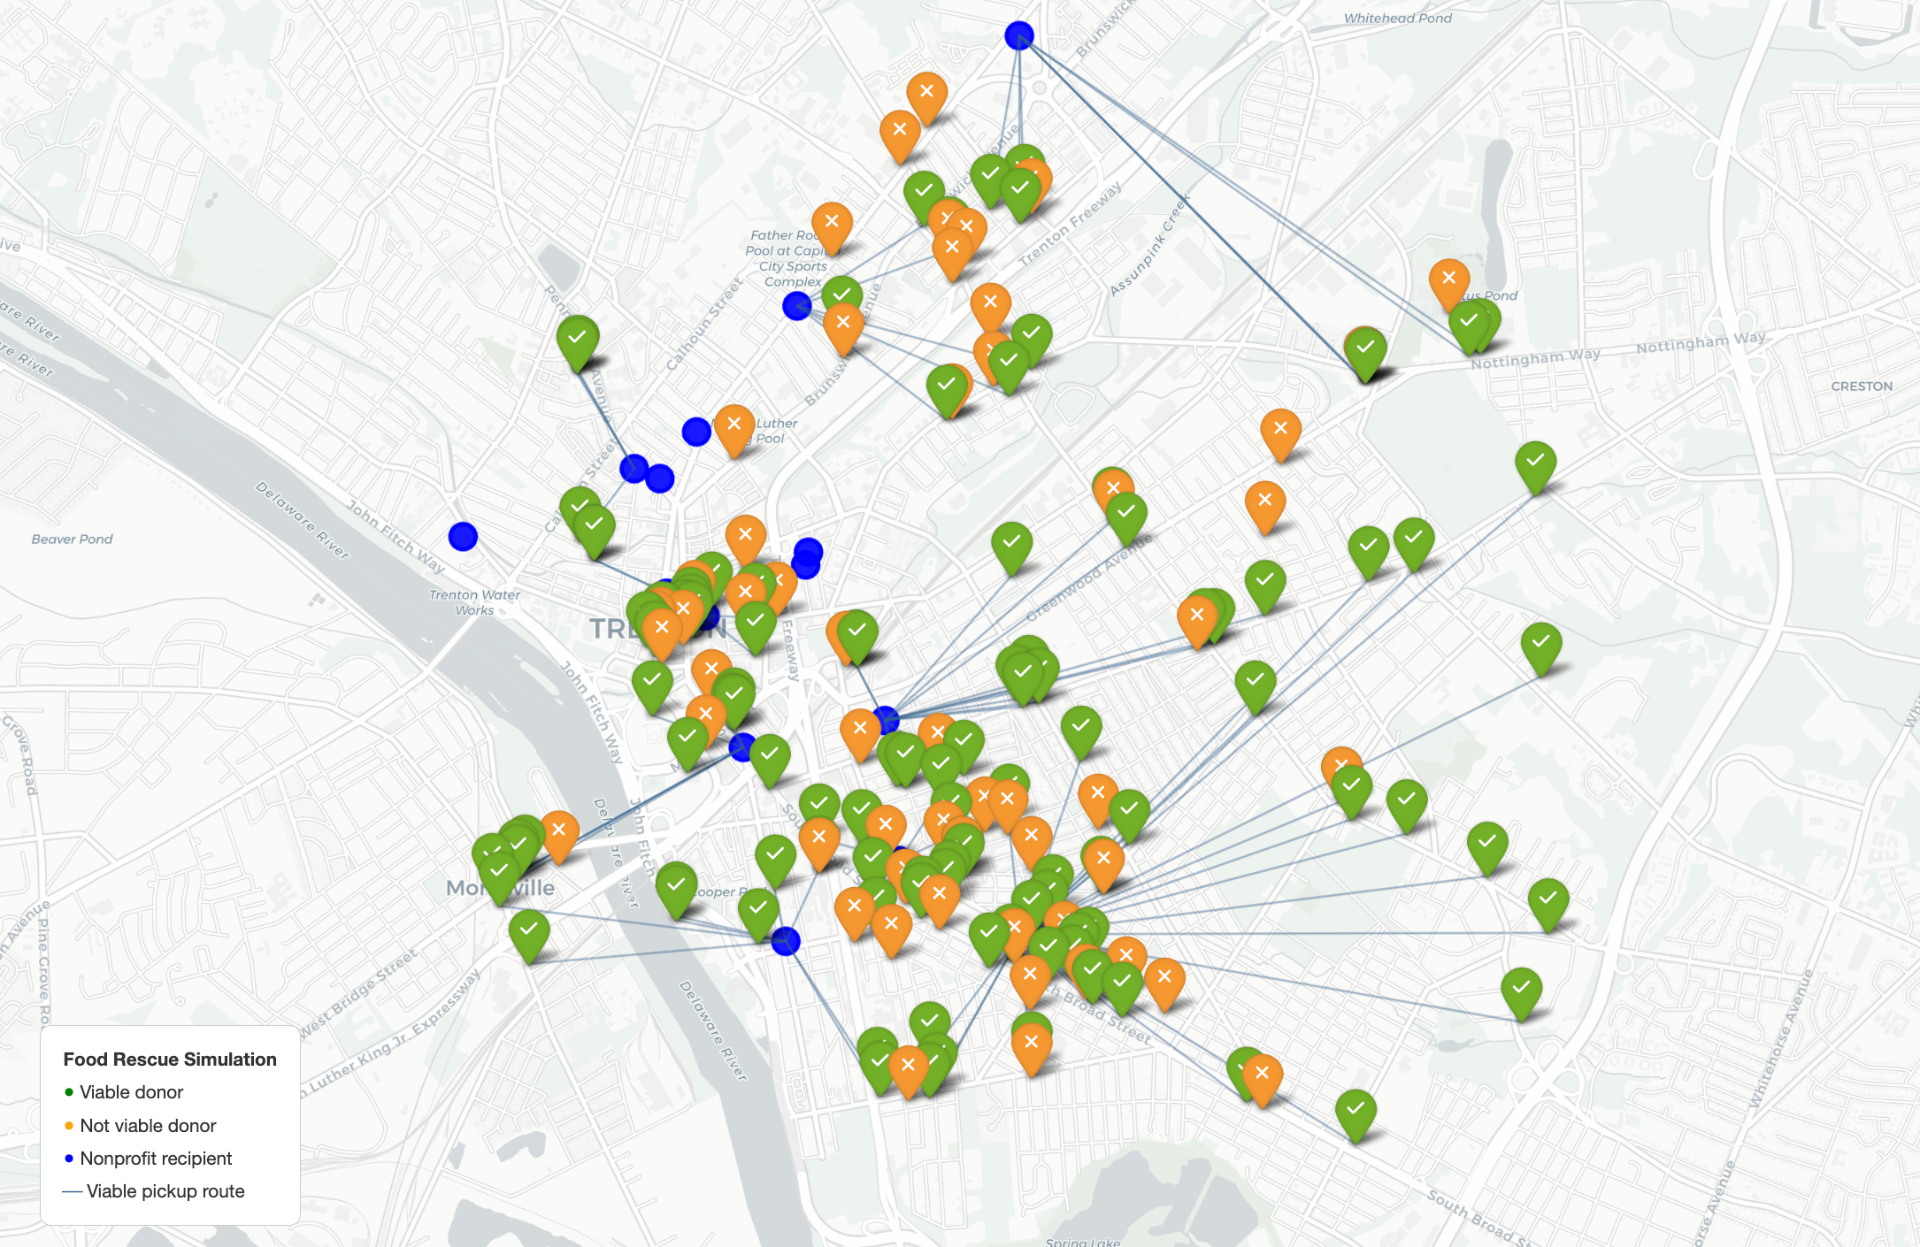
Food Rescue Simulation — viable donor pickup routes to nonprofit recipients in Trenton, NJ.
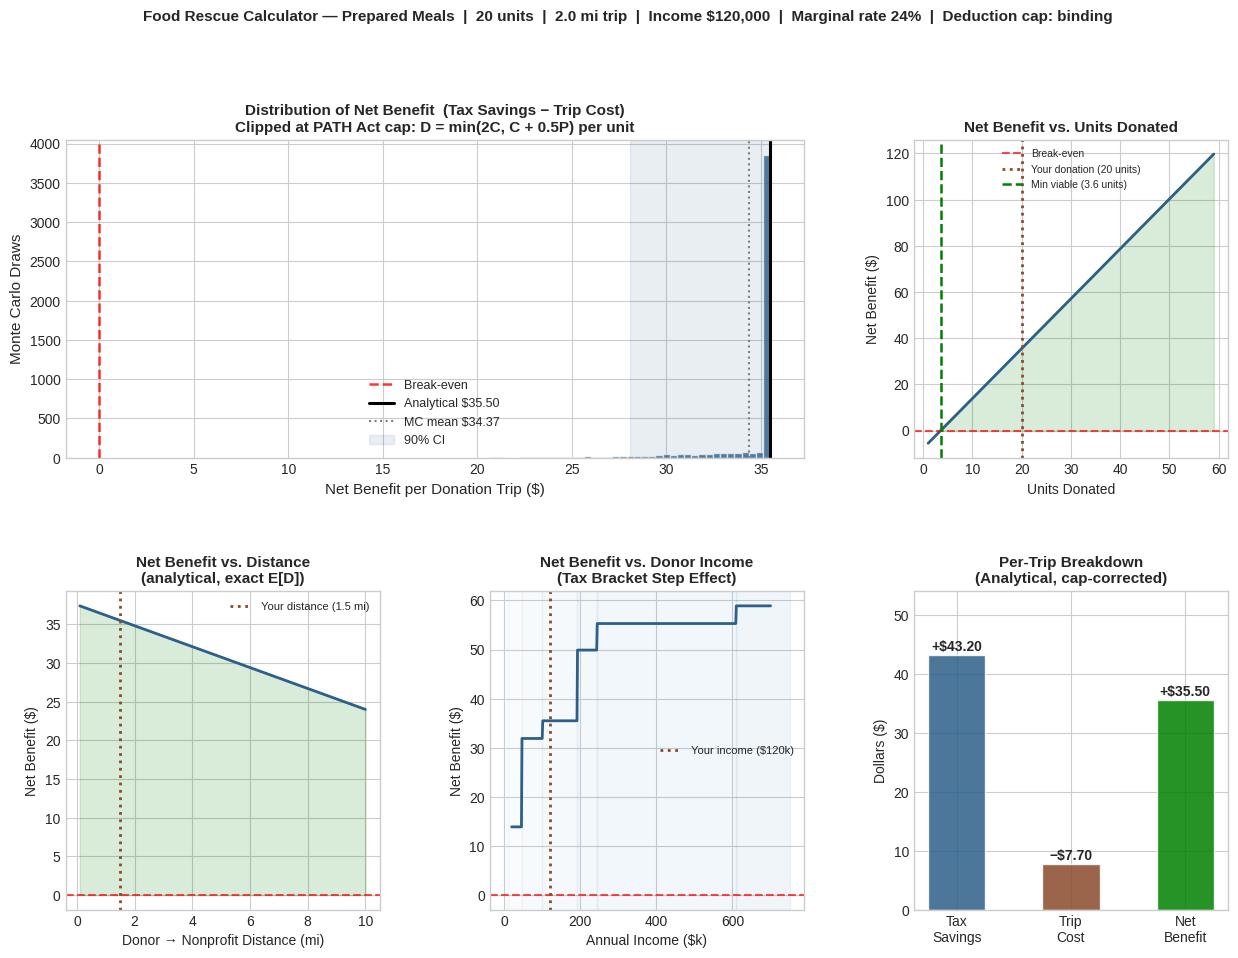 Food Rescue Calculator — analytical and Monte Carlo net-benefit model under the PATH Act enhanced deduction cap.